Google Ads ROI Spreadsheet
When running Google Ads, it is critical to have a handle on the return on investment for your campaigns. Without a good understanding of the ROI, you will have no idea if your campaigns are working or if you are throwing money away. Today, we're giving away the spreadsheet we use for all our clients to ensure they get a great return.
We will review every line of the spreadsheet, explaining each metric and its relevant numbers, and then assess whether our campaign has a positive return on investment.
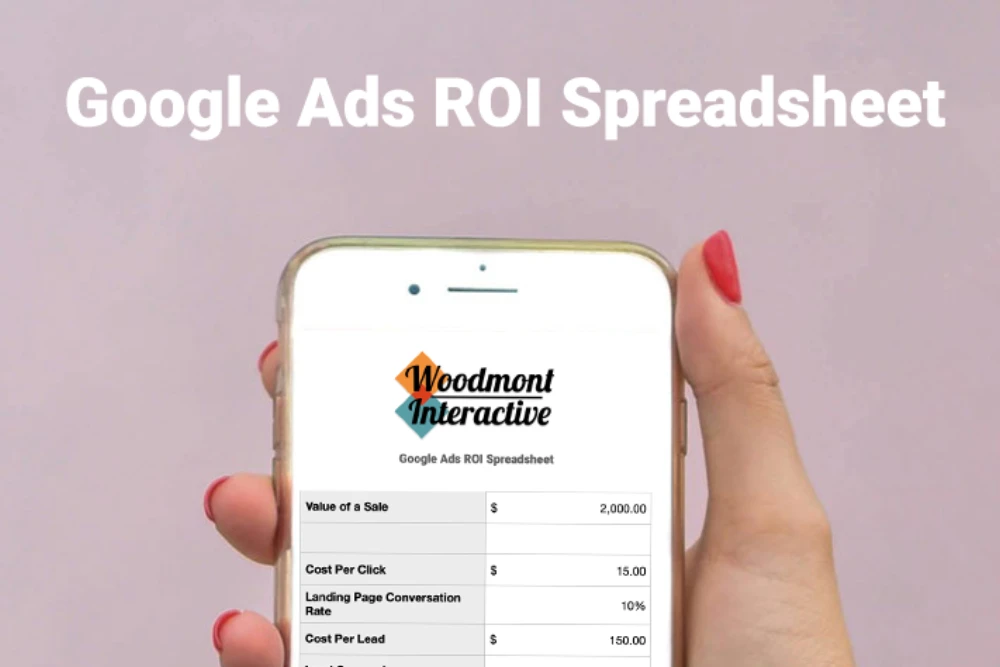
First, go get the spreadsheet and then come back here to go through it.
Value of a Sale
The first thing we need to do is determine the value of a sale to our business. As with everything, the devil is in the details. There are multiple ways to look at this number, and depending on where you go on the internet, you will see different theories. Since we're evaluating this number as the value advertising brings to our business, it's logical to view it as gross profit. That means the value of the sale should be the revenue of the sale less all other expenses except advertising expenses.
For instance, if I am selling a camera lens, the revenue from the sale would include the lens's cost and any fees taken by the platform I am selling on. I want to strip this down until I get to the profit that is coming to my business in the end.
If I am selling a service, we would do a similar calculation as the lens above, but I would look at the lifetime value of the customer less any expenses. For services like landscaping, you might expect a lawn cut to generate $45 in revenue and a new client to stay for 10 cuts, resulting in a lifetime value of $450. Then you would subtract any of the costs of the reductions (fuel, labor, etc) to get the profit.
You get the idea. You want to determine how much a sale from advertising is adding to your business, and this will be the top line of our spreadsheet.
Costs

Next, we will look at some of the costs associated with advertising. The two key performance indicators are the Cost per Lead and the Cost per Sale. We'll get to these numbers by first examining the Cost per Click, then assessing how well our landing pages and sales process convert.
Cost Per Click
The Cost per Click is pretty self-explanatory for Google Ads, and you can find this in your Google Ads manager account. How much are clicks from Google to your landing page costing you? Typically, the lower the better, although some of it depends on whether you are reaching the right audience and the intent of their searches.
Landing Page Conversion Rate
Of the clicks that you get from Google Ads, what percent of those take the action you want them to take? For a service-based business, what percentage of these will become leads? For an e-commerce business, this is going to be what percent of the traffic turns into sales. It is as simple as that. The higher the conversion rate, the better. A general rule of thumb for a reasonable conversion rate is 5-10%, but this varies greatly depending on the vertical. This is one of the reasons a good marketer can add significant value to your campaigns, as they have a deeper understanding of your target audience and goals.
Cost per Lead
From the Landing Page Conversion Rate and the Cost per Click, we can calculate the Cost per Lead. The Cost per Lead is calculated as (Cost per Click) / (Landing Page Conversion Rate). Again, simple stuff, but a critical metric to keep tabs on as we want to get this as low as possible.
Lead Conversion
Next, we move into Lead Conversion. In other words, what percentage of those leads become actual paying customers? In the case of an e-commerce business, this would be 100% as all lead conversions are sales. However, for a service business, we need to schedule a call with the lead who converted from the lead form and then attempt to close the sale. If you get about 30% you are probably doing pretty well, but again, this is going to be niche-specific.
Cost per Sale / Client
Now we can calculate the Cost per Sale. This is the (Cost per Lead) / (Lead Conversion Rate). With that, we have all the data we need to determine if we are getting a positive return on investment for our campaign. The rest of the spreadsheet is just playing with numbers to see how much benefit to our business a given amount of ad spend is going to give.
Return on Ad Spend / Return on Investment

And we finally get to the result, which is simple enough. The formula for the Return on Ad Spend is the (Value of a Sale) / (Cost per Sale). If this is greater than one, then our ad spend is giving us a positive return on investment. If this is less than one, then we are losing money on our ads. You'd want some wiggle room here if possible. So, for instance, if the Return on Ad Spend is only 1.05, that may not be enough to generate the types of returns that you want. Experimenting with different ad strategies is an effective way to lower the CPC or make your landing page more efficient at converting visitors into sales. There are lots of things you can experiment with to get better results.
Playing with the Numbers
Once we have the ROAS, we can start playing with some numbers to see what kind of return we can expect based on different ad spends. The bottom of our spreadsheet is set up to do this. We can enter the ad spend and then check what the expected number of clicks, leads, clients, and ad spend will be.
Conclusion
Hopefully, you find this little helpful spreadsheet. We see that clients find it useful here, as it gives an excellent overview of the targets you need to hit to make your ad spend profitable.
As always, good luck with your business, and if we can be of any help, don't hesitate to contact us